Enterprise Field Service Mobile App & Web Portals
Overview
Stats & Stories originated from a need to transform a manual image sharing process into an easy-to-use mobile application. Over time, it evolved into a mobile hub salespeople could use to log activities and access robust digital libraries while completing tasks in the field. We set out to create an app to maximize usability & drive user adoption while reducing the time personnel devoted to administrative work.
My Role
From the inception of its MVP, I have been leading the UX of States and Stories. Today with efforts focused on the evolution of the UX of its mobile and web portal applications my role has shifted to oversee all evolution efforts and tackling customer pain points in collaboration with a team of developers. Check out the project details below.
“I want our people to feel like they’re Inspector Gadget.”
— Lead Sales Manager
The MVP
Mobile Application
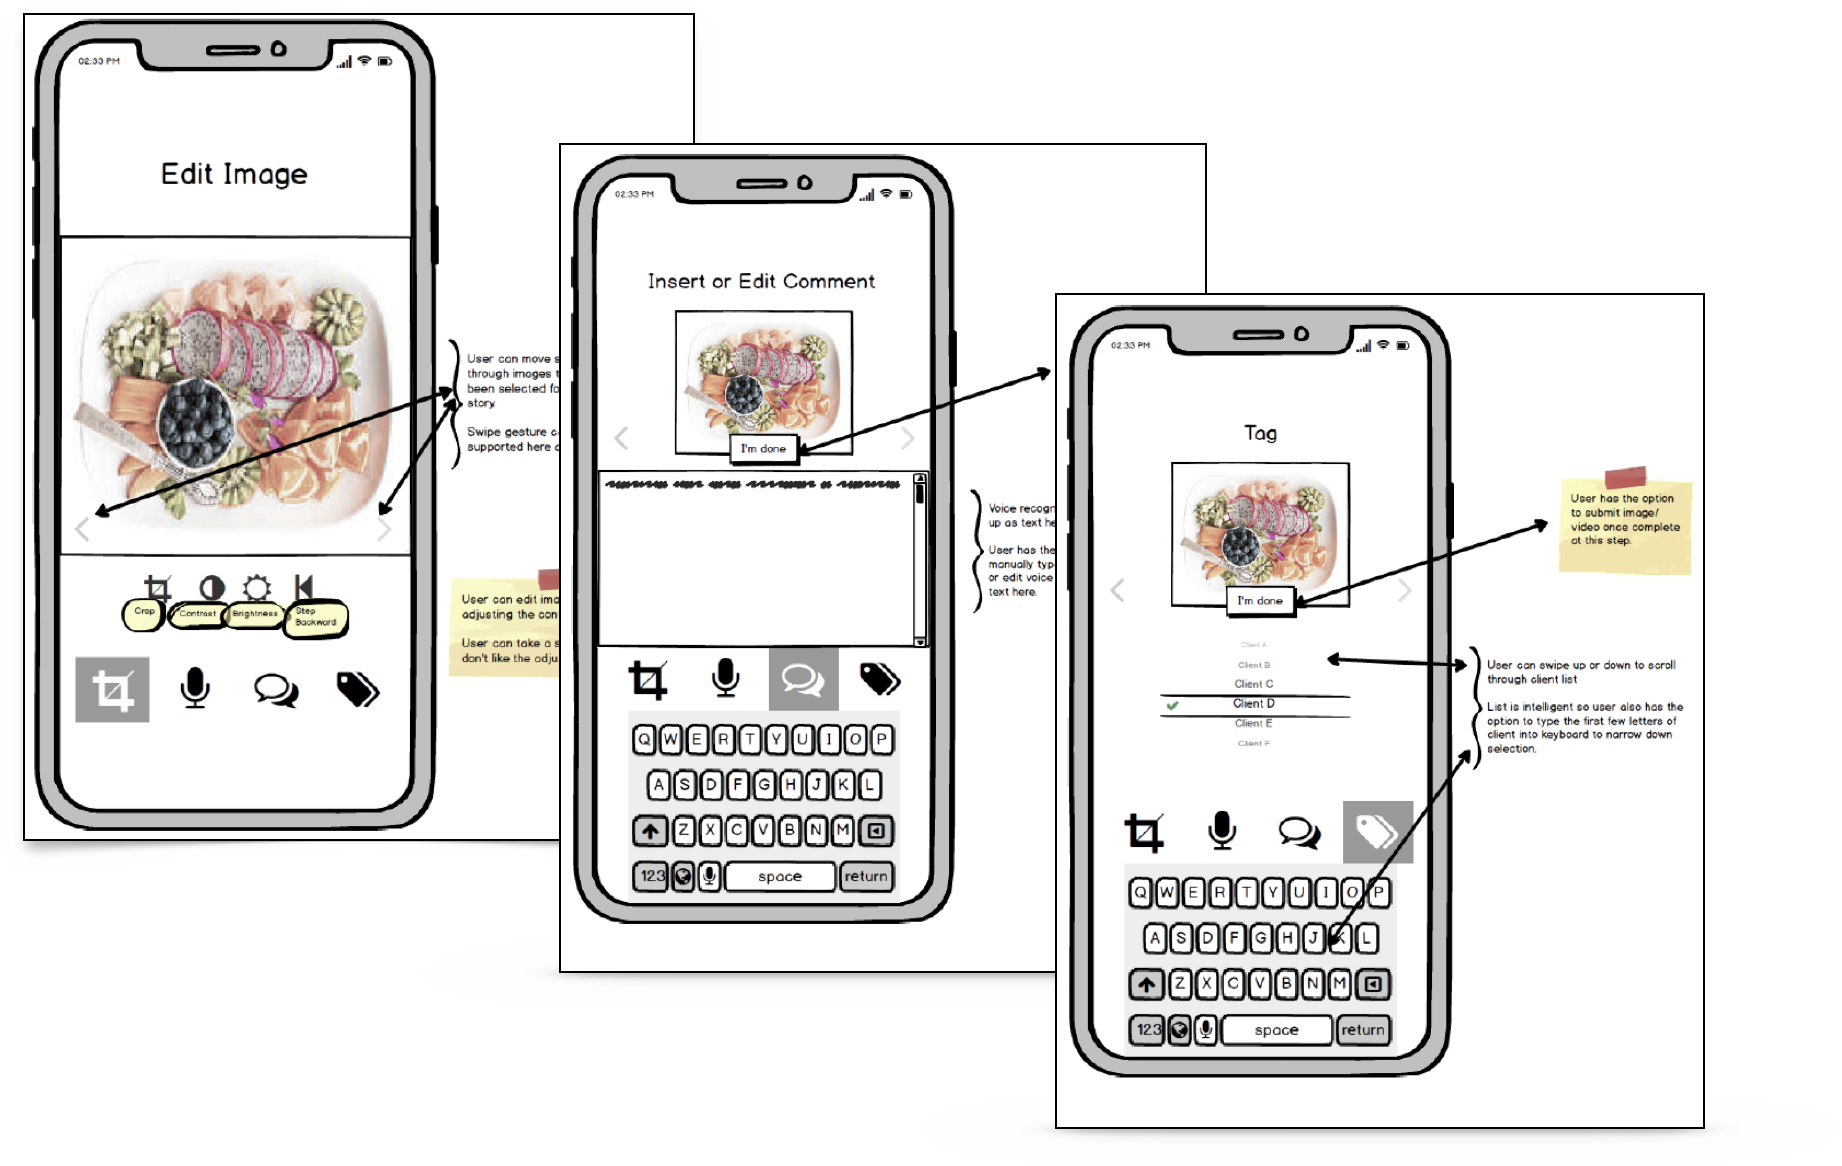
A mobile application for salespeople to operate at events in the field was practical; it would be used to upload photos and tag them with relevant data for categorization. As a result, data would become more reliable because it was entered in a timely and standardized fashion.
Web “Curator Portal” Application
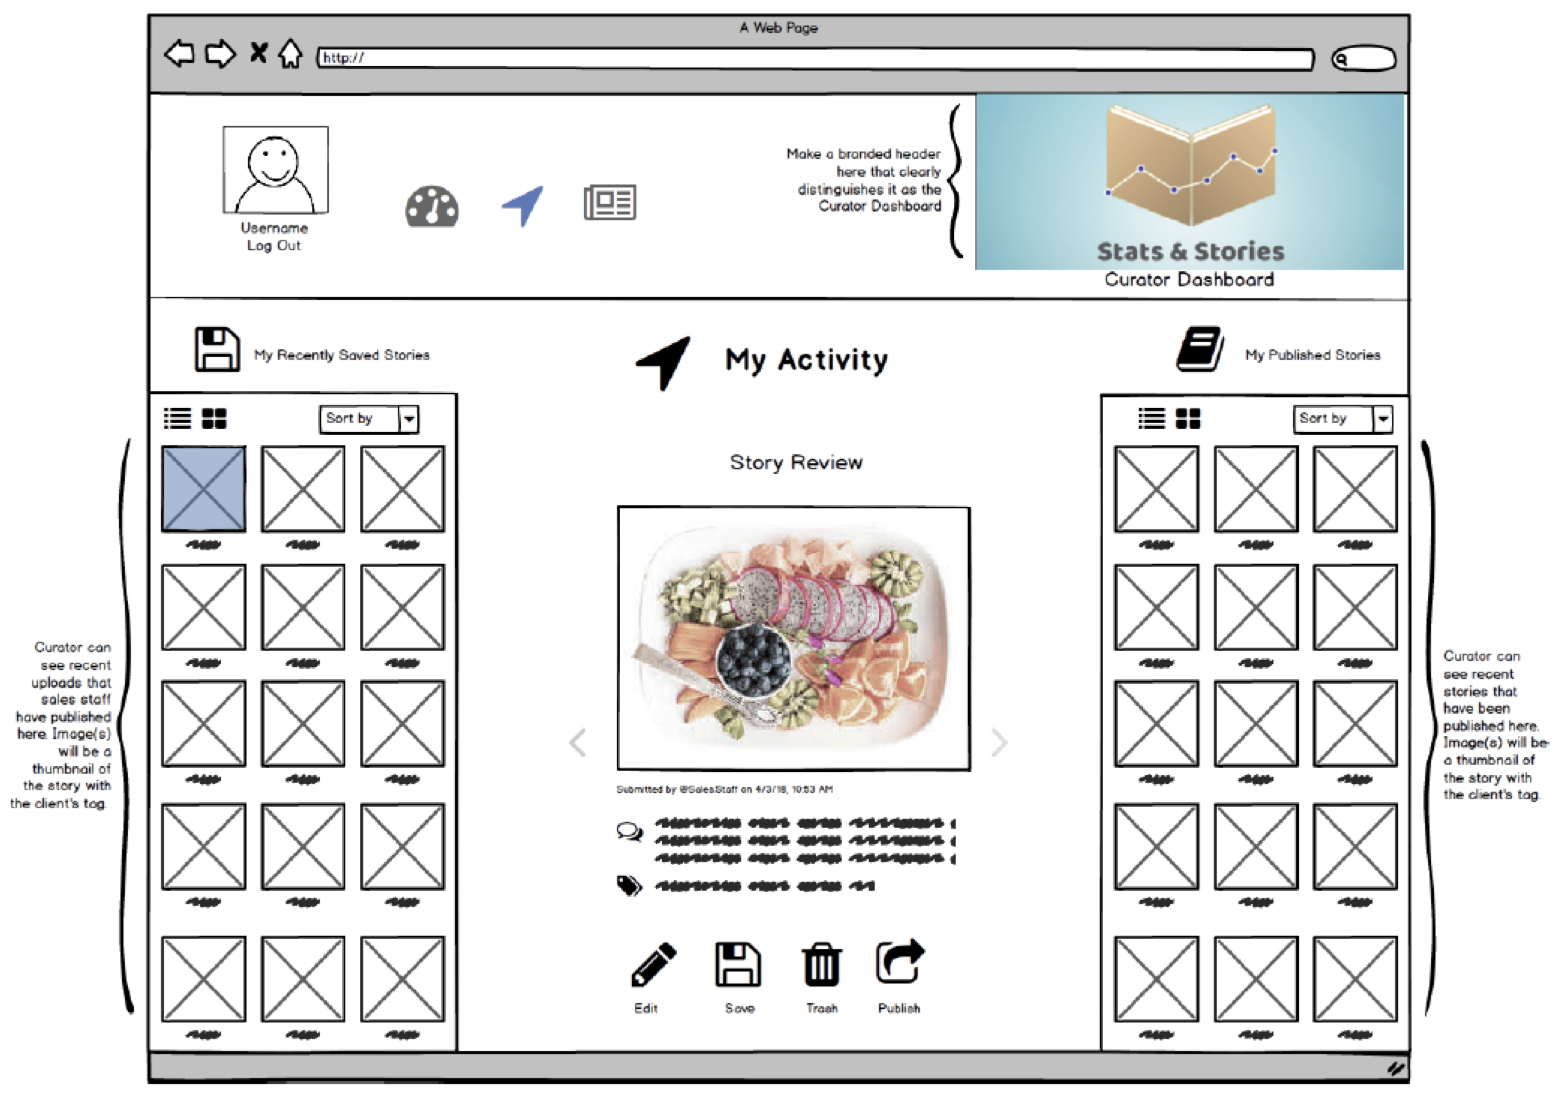
Rather than stash generic images in a repository, the curator portal allowed users to filter, search, edit and publish images to a digital gallery. Access to a public gallery was utilized for ongoing outreach to customers and prospects.
Lo-fidelity Wireframes


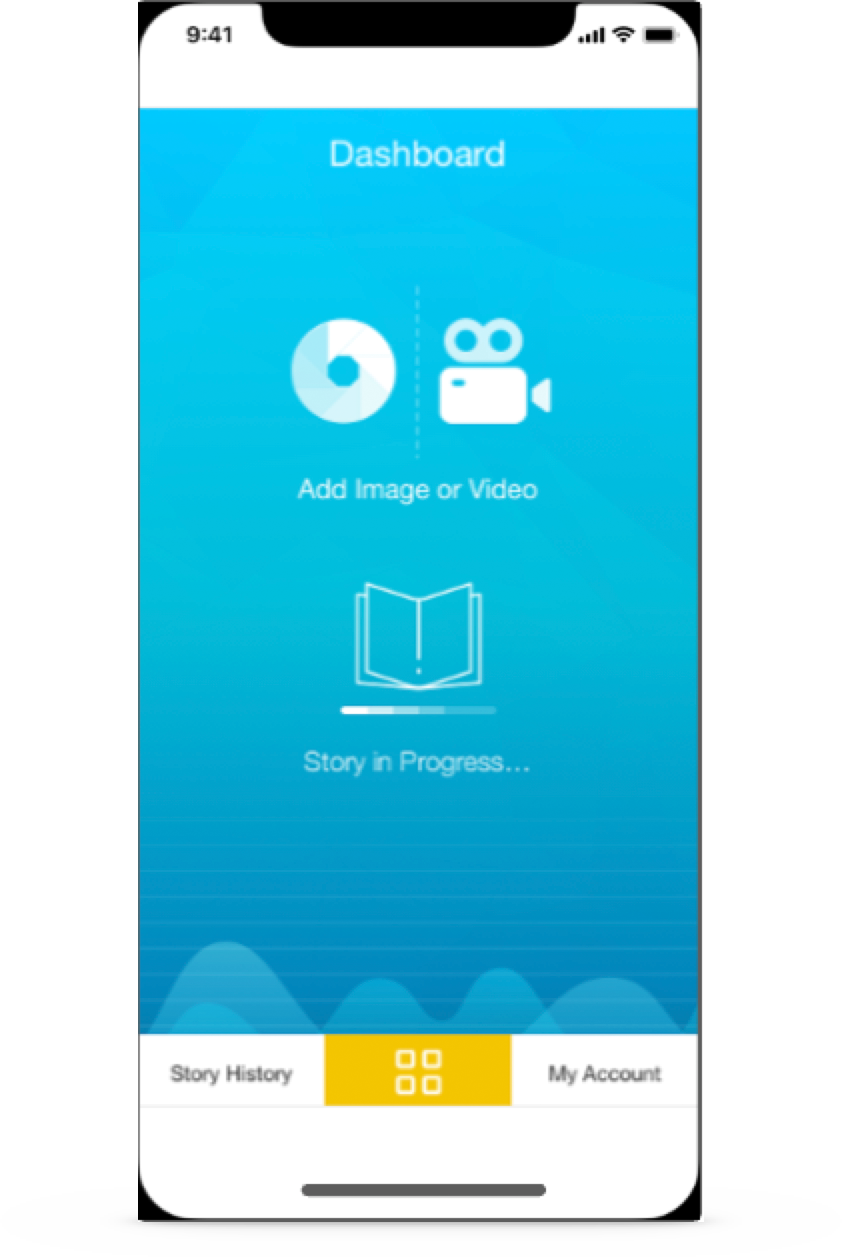
Hi-fidelity Prototype
77%
of staff installed Stats & Stories and submitted photos within the first 30 days of use
Reflections
It took us about 8 weeks in total to launch the MVPs. They were a necessary step to validate the adoption of our solutions by the salespeople and administrative staff. It was exciting to be a founding member of the team, and we were pleased with the outcome considering it was the client’s very first mobile application.
Next steps
We received informative feedback from the users after go-live which we used to form our design backlog for Phase 2. The client continued to enhance the application in future releases and developed new features to support related field service activities.
Scroll to see more
Phase 2 - Present
Design Thinking Workshops
Using feedback we received from the MVP, I generated a design backlog. We then launched a series of user interviews & workshops with the client to discover new features to add to Stats & Stories and its accompanying web tools for admins.
I facilitated ideation sessions using methods such as storyboarding, analogies, mind maps, and brainstorming. I would collaborate with the client and development teams to select priorities by examining criteria like implementation rationality, user delight, and client business processes.
Mobile Application Enhancements
-
Dashboard 2.0
In the design thinking workshops, we discovered there was a need for separate modules that required separate functionality from the first iteration of Stats & Stories. The original version of the app became the ‘Stories’ module while also adding a product directory, digital library, event manager, sales call details, and a review/approval workflow to track bonus awards on a quarterly basis.
-
Product Directory
Salespeople would historically keep a physical catalog of all the products with them to reference during meetings. This digital directory consolidated hundreds of sheets of paper into a simple, searchable list.
-
Digital Library
Special offers were difficult to share with customers since it often required a salesperson to handwrite or type a discount code in a text or email to a client. The digital version consolidates all active offers in one spot with a share feature that allows the salesperson to share the coupon via text or email.
-
Event Manager
The event manager business process was created as result from developing the Stats & Stories mobile application, so we naturally chose to manage it through the app as well.
-
Bonus Awards
Each quarter, salespeople are required to provide proof of sales that are eligible for bonuses. The process was managed via emails and spreadsheets prior to developing a mobile workflow and web admin tools. Salespeople are able to track their submissions and progress on a quarterly and annual basis.
-
Web Admin Reporting Tools
It wasn’t long after launching the mobile application’s MVP that we started to receive requests for specific analytics outside the original scope of work. We could track them down through a series of MySQL tables, but inevitably built out a separate area in the web portal for reporting.


